

Introducing the Revenue System Score
A Diagnostic Framework for Your Brand-to-Demand Go-to-Market Engine
A Confession About Ambition
I started Vallenwood Consulting with a mission that was, if I'm honest, more impressive on a slide deck than it was useful to the clients I wanted to serve. 'Optimizing your brand-to-demand go-to-market engine' sounds sophisticated. It signals domain expertise. But it doesn't clearly answer the one question every potential client is actually asking: what does working with you get me?
That tension sent me back to first principles. Over the past year I've published a series of essays on brand strategy, value-based pricing, and go-to-market execution, not as a content calendar exercise, but as a genuine attempt to map the intellectual terrain I was navigating. And somewhere in that process, the connections between those disciplines became impossible to ignore.
Brand clarity drives pricing power. Pricing power reflects value architecture. Value architecture shapes how you go to market. And the go-to-market motion, when it works, reinforces the brand. These aren't parallel tracks. They're a system. One that, when aligned, compounds. One that, when siloed, leaks.
That insight is the foundation of everything I'll describe below. And it is the reason I built the Vallenwood Revenue System Score model.
The Costly Illusion of Departmental Independence
Most companies don't have a marketing problem or a sales problem. They have a systems problem; one that hides in plain sight behind org charts, budget cycles, and the comfortable fiction that brand, pricing, and revenue execution are separate disciplines owned by separate teams.
The research on this point is unambiguous. In their foundational 2006 Harvard Business Review study, Philip Kotler, Neil Rackham, and Suj Krishnaswamy documented that the friction between marketing and sales isn't primarily interpersonal: it's structural. The two functions attract different talent, operate on different time horizons, and are rewarded for different things. Marketing optimizes for long-term brand equity and pipeline generation. Sales optimizes for this quarter's number. Neither goal is wrong. The problem is that each team pursues it without sufficient visibility into what the other is doing.
More recent data puts a hard number on what that costs. According to Gartner research, companies with inadequate marketing and sales alignment lose an average of 10 to 15 percent of their potential revenue annually. Forrester's data is even more striking: highly aligned organizations achieve 2.4 times higher revenue growth and twice the profitability of their fragmented peers. SiriusDecisions found that companies with poor cross-functional alignment lose approximately 10 percent of annual revenue through inefficiency and missed opportunity alone.
For a $10M company, that's a $1M problem. For a $50M company, it's a $5M to $7.5M drag on results that never shows up as a line item on a budget but absolutely shows up in your growth trajectory.
"The hidden price of departmental silos is a creeping erosion of competitiveness. While companies look outward for innovations and growth opportunities, they often lose more internally through poor alignment than they can gain externally." — Dr. Michael Schmidt, Senior Advisor, Boston Consulting Group
The leakage isn't just financial. Forrester research found that 68 percent of B2B buyers abandon a purchase process when they receive contradictory messages from a vendor. Think about what that means in practice: your brand says one thing, your pricing signals another, and your sales team is winging a value conversation that was never anchored in either. The deal dies, and the buyer moves on without ever telling you why.
This is the problem the Vallenwood Revenue System Score (RSS) was designed to diagnose. Not with a generalized audit or a framework borrowed from a management consulting playbook, but with a precision instrument built to surface exactly where your system is leaking, and why.
The Core Philosophy: Revenue as a System
The foundation of the RSS model rests on a deceptively simple idea: sales and marketing, when optimized, do not operate as independent functions. They operate as a system of value creation and delivery.
Philip Kotler's foundational work on value-creating marketing established that marketing's primary responsibility is not lead generation or brand awareness: it is achieving profitable revenue growth. That framing matters. It positions marketing not as a cost center that feeds leads to a revenue-generating sales team, but as a core driver of commercial outcomes. The implications for how marketing and sales should be structured, and measured, are profound.
The systems lens goes further. When brand positioning, pricing strategy, and go-to-market execution are tightly connected, each function amplifies the others. Your positioning creates category gravity that makes your pricing make sense. Your pricing architecture reveals the full scope of the value you deliver, which makes your go-to-market motion more specific and credible. Your GTM execution generates market intelligence that sharpens your positioning. The system creates a virtuous cycle that feeds and sustains itself beyond the current quarter or annual year time horizon.
When those connections break down through departmental silos, leadership transitions, rapid growth, or simple organizational entropy, value leaks at every handoff. The brand makes promises the sales team doesn't reinforce. The pricing strategy fails to reflect the value the product actually delivers. The GTM motion is too generic to cut through a noisy market. And measurement is so fragmented that no one can diagnose which node in the system is failing.
The Revenue System Score is designed to map that system for your company: quantify where it is strong, identify where it is leaking, and give you a precise starting point for optimization.
How the RSS Model Works
Step One: The Intake
The process begins with a short diagnostic questionnaire. We've designed this intake to be completable in a single sitting, something you can work through during a lunch break, not a multi-week discovery engagement. The questions focus on observable outcomes and directional indicators rather than sensitive financial data; wherever precise figures feel too private to share with a third party, we ask for ranges and high-level signals instead.
And here's the part that surprises most people: the intake form, your score, and your initial report are completely free. No sales call required. No commitment to further engagement. You answer the questions, we run the model, and you get a full diagnostic of your revenue system at no cost.
Step Two: The Scoring Engine
Once we receive your intake, a proprietary scoring algorithm evaluates your go-to-market system across five interconnected pillars. Each pillar represents a critical node in your revenue operating system — a place where value is either created and channeled forward or lost.
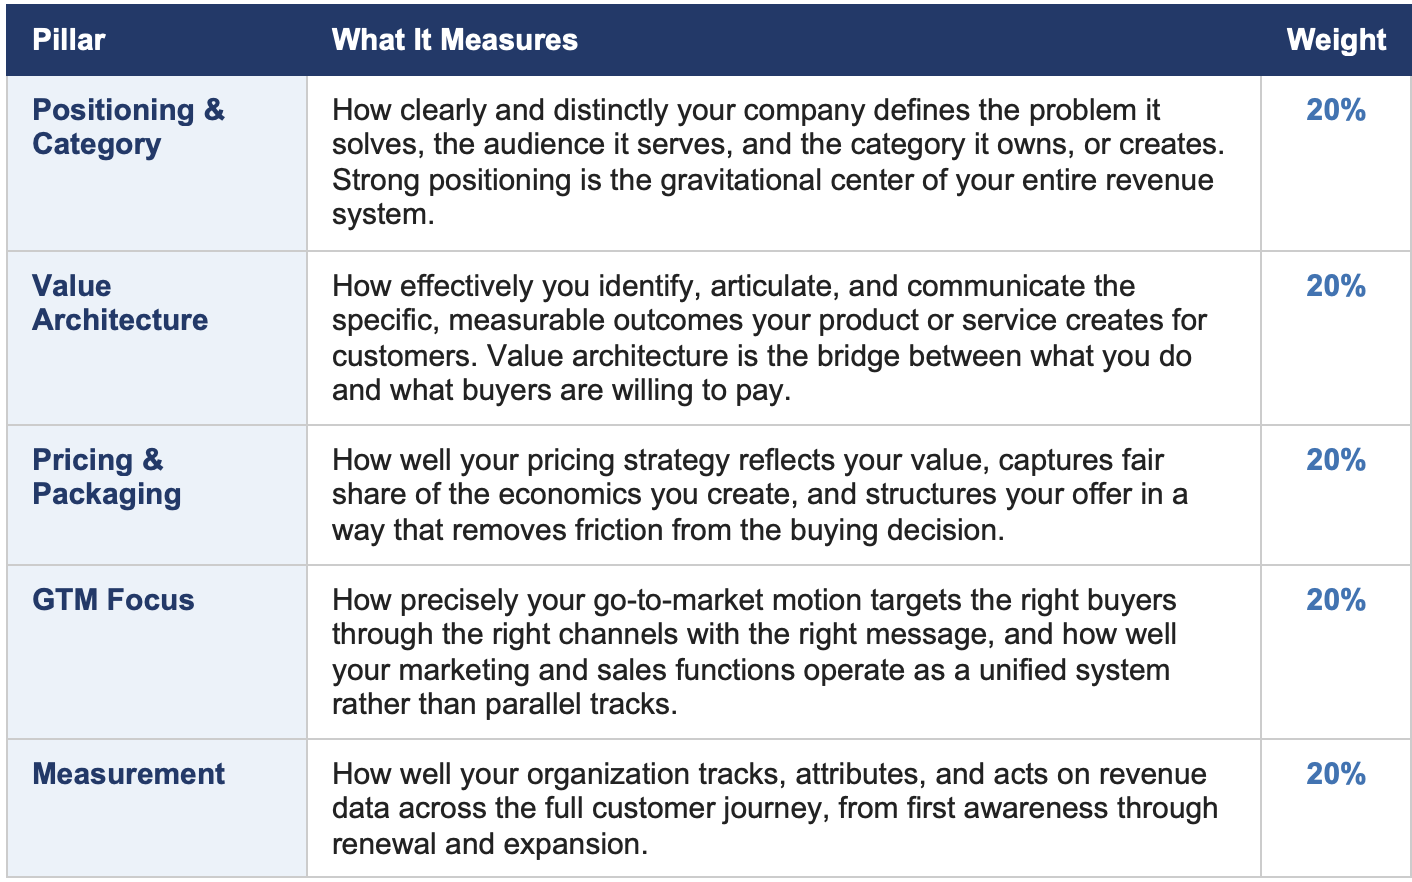
These five pillars are not evaluated in isolation. Part of what makes the RSS model distinctive is that it also scores the connections between pillars; the handoffs where value is most commonly lost. A perfect score in Positioning means little if your Value Architecture fails to operationalize that positioning for buyers. Strong Measurement is hollow if your GTM motion isn't generating the right signal to measure in the first place. The aggregate score reflects system performance, not just component quality.
Scores are aggregated on a 0–100 scale, producing a single number that represents your company's overall revenue system health alongside five individual pillar scores that tell you precisely where to focus.
Step Three: The Analysis
A score without context is just a number. The real value of the RSS model is in the analysis layer that accompanies it.
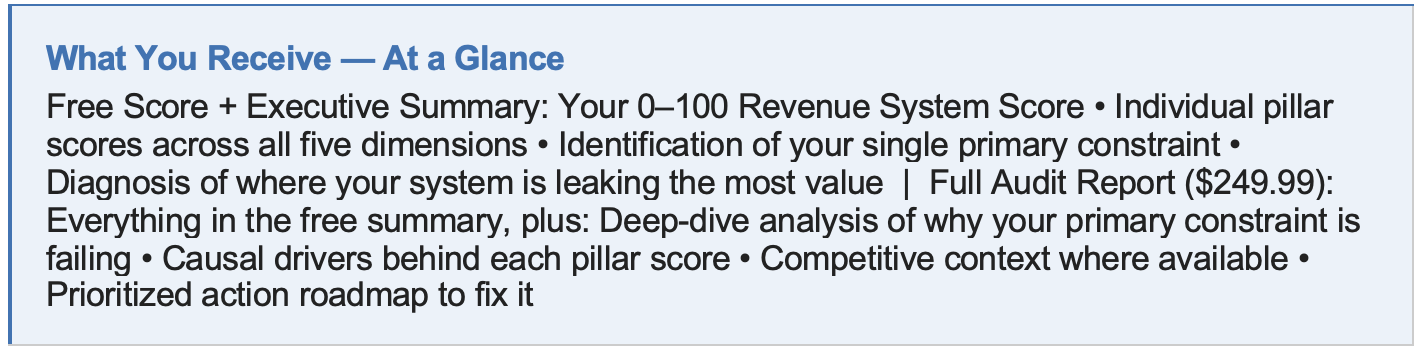
Every RSS recipient receives a structured executive summary, included free with your score, that does something more precise than a general pillar breakdown. It identifies the single primary constraint most likely holding back your revenue system: the one node in the chain where the most value is being lost, and where focused attention will have the highest near-term return. Think of it as a diagnosis. You’ll know what’s wrong, where it’s located, and why it matters without spending a dollar.
For companies who want the full picture, the RSS Full Audit Report, available for a one-time investment of $249.99, goes a level deeper. Where the executive summary tells you what your primary constraint is, the full audit explains why it’s failing: the specific causal drivers behind your score, the structural or strategic conditions that created the gap, and a concrete plan to fix it. You’ll receive a comprehensive pillar-by-pillar analysis, competitive context where available, and a prioritized action roadmap you can take directly to your team. For context: a single hour with a major marketing consulting firm typically runs $300 to $500 or more. The full audit delivers a complete strategic diagnosis and a path forward for less than that.
Why This, Why Now
The Revenue System Score isn't a thought experiment. It's the product of direct marketing experience, a year of research and writing on the disciplines it covers, and a genuine conviction that most companies are leaving significant revenue on the table not because they lack talent or effort, but because they lack a clear picture of where their system is working and where it isn't.
The best sales and marketing teams aren't just good at their individual jobs. They're aligned on what they're building together. They share a language around value. They've connected their brand to their pricing and their pricing to their go-to-market motion. And they measure that whole system with enough rigor to know, in real time, what's accelerating and what's stalling.
The RSS gives you that picture. Free, specific, and actionable — with a path to go deeper if you want it.
Take the assessment. See where you stand. And use the insight as a lens that finally shines light on what your revenue system is doing, and what it's capable of.