

RSS100: The Revenue System Score in Action
Scoring the Marketing CRM & Automation Sector: Who's Winning the Brand-to-Demand Race?
From Firm-Level Diagnostic to Industry-Level Lens
One of the unexpected gifts of building a scoring model is what happens when you step back and look at the data at scale. The individual firm-level score answers the question every executive should be asking: how well is my revenue system operating? But when you aggregate that analysis across a full industry, a new and more interesting question emerges.
How well is the industry performing?
That's the premise behind the Vallenwood RSS 100 — a recurring series in which we apply the Revenue System Score framework to publicly traded companies in a single sector, using only publicly available signals: website positioning and messaging, pricing page architecture, go-to-market motion as evidenced through content and channel strategy, investor communications, analyst reviews, and attribution capability indicators.
For our inaugural edition, we chose a category that is simultaneously the most competitive, most watched, and — as we'll show — the most instructive for understanding the gap between what companies say about value and what they actually demonstrate in the market: the Marketing CRM and Automation sector.
Why Marketing CRM & Automation?
Few categories are as hypercompetitive, or as strategically consequential, as the platform layer that companies use to manage their go-to-market execution. The Marketing Automation market is projected to grow from $47 billion in 2025 to over $81 billion by 2030 — a compound annual growth rate of 11.5 percent. North America accounts for 35 percent of that market. The players in this space aren't just building software; they're building the infrastructure through which trillions of dollars of commercial value flows.
They are also, by the logic of the RSS model, exactly the type of company that should be exceptionally good at brand positioning, value communication, pricing architecture, and go-to-market execution. These companies sell marketing and revenue tools. Their product is the apparatus of the revenue system. If anyone should score high on the RSS, it's them.
The reality, as the data shows, is more complicated — and more instructive.
Methodology: How We Scored the Sector
Each company in the RSS 100 inaugural cohort was evaluated against the same five-pillar framework used in the client-facing RSS assessment. Because this analysis uses public signals rather than a company-submitted intake, we adapted the scoring criteria to reflect observable indicators for each pillar:
• Positioning & Category: Clarity and distinctiveness of homepage messaging; presence of a defined category narrative; consistency of positioning across website, investor deck, and analyst coverage; evidence of intentional category creation vs. category followership.
• Value Architecture: Specificity and credibility of stated customer outcomes; presence of ROI claims and case study evidence; depth of use-case framing vs. feature listing; clarity of the problem being solved for distinct buyer personas.
• Pricing & Packaging: Transparency of pricing page; logical structure of tier differentiation; alignment between pricing architecture and stated value proposition; absence of confusion-inducing pricing complexity or opacity.
• GTM Focus: Precision of audience targeting evidenced through content, channel selection, and partner ecosystem; degree of sales and marketing motion coherence; specificity of ICP framing in go-to-market materials; cross-functional signal consistency.
• Measurement: Availability of attribution and analytics tooling within the product; quality of measurement-related content and thought leadership; strength of reporting architecture for demonstrating revenue impact.
Scores were assigned by pillar on a 0–100 scale and aggregated using equal weighting across pillars, consistent with the client assessment model. Where signals were ambiguous or insufficient, we applied a conservative score rather than speculating. All scores reflect publicly observable GTM behavior as of Q1 2026.
The RSS 100: Marketing CRM & Automation — Q1 2026
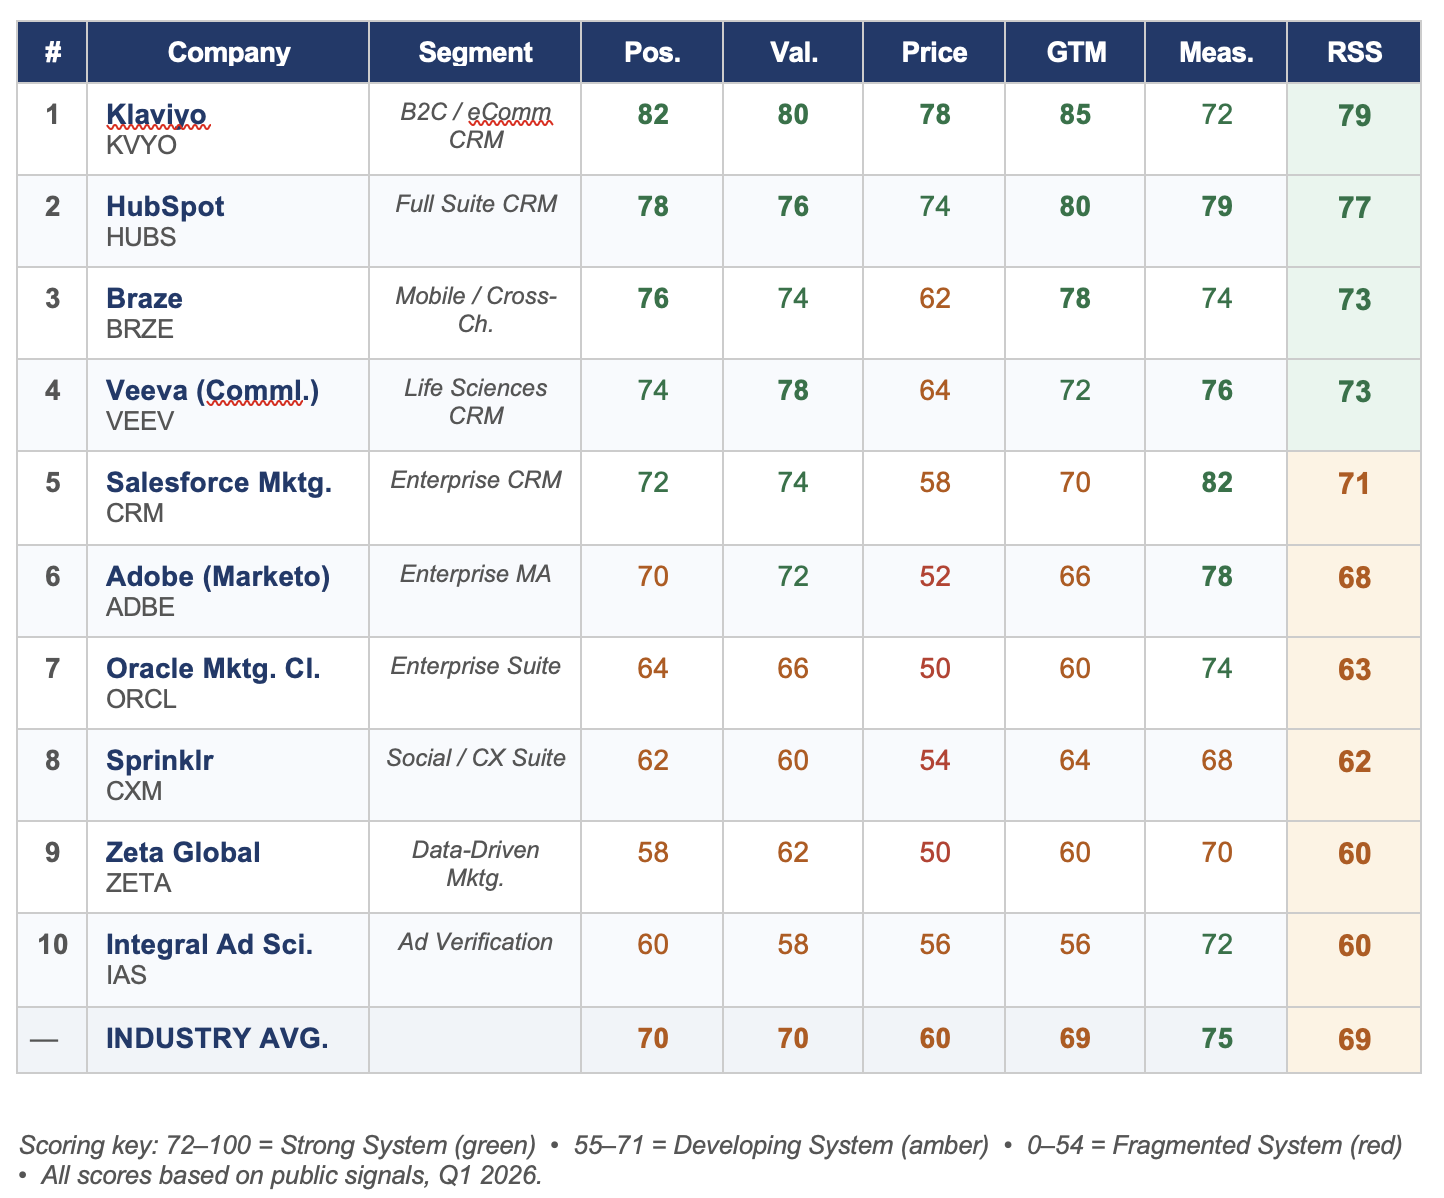
What the Data Tells Us
Industry Composite Score: 69/100 — A Sector in Amber
The Marketing CRM and Automation sector posts a composite RSS score of 69 — squarely in the "Developing System" range. For an industry whose entire product value proposition is helping other companies run better go-to-market systems, a score in the mid-sixties is, to put it charitably, an opportunity. It signals that even in one of the most sophisticated, data-rich, and marketing-native sectors in the economy, the gap between revenue system theory and revenue system practice is very real.
The variance across companies is equally instructive. The spread between the top and bottom scorer in this cohort is 19 points — a meaningful gap that reflects fundamentally different approaches to brand-to-demand execution, not just differences in product quality or market position.
Standout: Klaviyo — Purposeful Positioning Pays
Klaviyo earns the highest composite score in this cohort with a 79, and its performance illuminates a core principle of the RSS model: the power of deliberate category ownership. Where most platforms in this space compete on feature breadth and integration depth — speaking broadly to 'marketing teams' and 'any business' — Klaviyo made a precise, defensible bet on B2C and e-commerce brands and built every layer of its revenue system around that choice.
Its homepage doesn't hedge. Its pricing page is clear and architecture-logical. Its go-to-market motion — centered on the Shopify ecosystem and reinforced through e-commerce-native content — creates a self-reinforcing system where its category positioning makes its value claims credible and its value claims justify its pricing. Klaviyo's Q1 2025 revenue of $279.8 million, representing 33 percent year-over-year growth, isn't just a financial result. It's a validation of what happens when your revenue system components compound rather than conflict.
Its weakest pillar is Measurement (72), which reflects the inherent complexity of multi-touch attribution in a mobile-first, cross-channel context — a challenge shared across the sector, but one that Klaviyo is better positioned than most to solve given its data infrastructure.
HubSpot: The Alignment Premium
HubSpot's composite score of 77 reflects what may be the most coherent brand-to-demand system in the cohort. Its positioning has evolved credibly from 'inbound marketing tool for SMBs' to 'full-suite CRM platform for growing companies' — and it has managed that upmarket expansion without losing the positioning clarity that built its brand in the first place.
The launch of Breeze AI and advanced Workspaces in 2025 represents a strategically significant GTM move: rather than simply announcing enterprise features, HubSpot built those features into a narrative about eliminating operational complexity — the exact value story that resonates with mid-market buyers escaping Salesforce's Total Cost of Ownership burden. That's integrated brand and product strategy working as a system.
HubSpot scores highest in GTM Focus (80) — a reflection of message discipline across channels and one of the most consistent ICP narratives in the sector. Its pricing pillar (74) reflects the inherent tension in contact-based pricing models, which create genuine friction at scale and represent the category's most common source of buyer friction.
Braze: Strong Signal, Unfinished Story
Braze earns a composite of 73, with a genuine strength in Positioning (76) and GTM Focus (78) — the company has built a compelling and differentiated narrative around real-time, cross-channel customer engagement and the mobile-first brand context in which that capability matters most. Their category story is coherent and their target audience is well-defined.
Where Braze loses points is in Pricing & Packaging (62) — a score that reflects a common enterprise software challenge: pricing opacity as a proxy for enterprise credibility. Requiring a custom quote for essentially all plans introduces friction at a moment when increasingly sophisticated buyers expect at least directional pricing transparency. This gap between Braze's strong positioning and its pricing architecture is the clearest example in the cohort of a system that is partially optimized — the top of the funnel is doing excellent work that the middle-funnel experience doesn't fully honor.
The Enterprise Incumbents: Power Without Precision
Salesforce Marketing Cloud (71) and Adobe Marketo (68) represent the archetype of what we call 'capability-rich, story-poor' GTM systems. Both platforms possess extraordinary depth — Salesforce's Agentforce positioning and enterprise-grade orchestration capabilities are genuinely compelling, and Marketo's B2B lifecycle management remains the benchmark for enterprise ABM execution.
But both companies score in the bottom half of this cohort on Pricing & Packaging (58 and 52, respectively) — a result that reflects pricing architectures that have accumulated decades of complexity, add-on logic, and negotiation dependence. A buyer approaching either platform cold cannot quickly understand what they'll pay, what they'll get, or why one tier is meaningfully different from another. That complexity doesn't just create buyer friction; it signals a misalignment between stated value and actual value delivery that sophisticated buyers notice.
Salesforce's Measurement score (82) is the highest in the cohort — a reflection of its unmatched data infrastructure and reporting depth. That strength, however, highlights the asymmetry: Salesforce can measure almost anything, but it struggles to communicate its value to buyers who haven't already committed to the ecosystem.
The Sector's Shared Blind Spot: Pricing as Value Signal
The single most consistent pattern in the RSS 100 data is what we're calling the Pricing Signal Gap. The sector's average Pricing & Packaging score is 60 — the lowest of all five pillars and the widest deviation from best-in-class performance. In an industry that sells tools explicitly designed to help other companies grow revenue, the pervasive use of opaque, custom-quote pricing represents a structural self-contradiction.
Pricing architecture is not just a commercial decision. It is a positioning statement. A transparent, logical, value-anchored pricing page tells a prospect: we know what we're worth, and we're confident enough in that value to show you. Its absence says the opposite — that the value is either too complex to articulate simply, or too variable to defend without a sales conversation. In a market where buyers do more research before engaging a salesperson than ever before, that conversation-dependence is increasingly a liability.
The era of overspending on tech without strategic alignment is gone. Smart, sustainable choices are what define modern marketing leaders. — Salesforce Ben, 2025 Market Analysis
The best-scoring companies in this cohort — Klaviyo and HubSpot — are, not coincidentally, the two that have made the most deliberate investments in pricing transparency and tier-logic clarity. Their pricing pages do real positioning work. They're not just a table of features; they're a value argument.
GTM Focus: The Widening Gap Between Specialists and Generalists
The sector's average GTM Focus score of 69 masks a bimodal distribution. Companies with clearly defined ICPs and category-specific narratives — Klaviyo, Braze, HubSpot — cluster in the high-70s. Companies that attempt to serve everyone — enterprise, mid-market, SMB, B2B, B2C, across every vertical — cluster in the low-to-mid 60s.
This is the go-to-market expression of the positioning problem. When you don't choose who you're for, your GTM motion can't be precise. Your content is generic. Your channel strategy is diffuse. And the message that reaches your buyer is simultaneously everywhere and nowhere — loud in aggregate but quiet where it matters.
The implication for companies in this sector — and by extension for every company evaluating their own RSS — is that specificity is a multiplier. Narrowing your defined ICP doesn't shrink your market. It focuses your revenue system on the buyers most likely to convert, retain, and expand — and that focus, compounded across the full system, is what drives the kind of growth the top-scoring companies in this cohort are posting.
What This Means for You
The Marketing CRM and Automation sector is one of the most sophisticated marketing ecosystems on the planet. These companies employ world-class marketers, have access to unlimited data, and sell tools specifically designed to optimize the exact functions we're scoring. If the average RSS in this sector is in the mid-60s, the implication for companies in less marketing-native industries is sobering.
It also suggests that the opportunity is real and accessible. You don't need to be Klaviyo to score like Klaviyo. You need to make the same type of intentional, system-level decisions: choose your category, articulate your value specifically, price in a way that reflects and reinforces that value, focus your go-to-market on the buyers who are most likely to win with you, and measure everything with enough discipline to know what's working.
That's the hypothesis behind the Vallenwood Revenue System Score. And this industry analysis is the first empirical demonstration of what happens — in a real market, with real companies — when those decisions are made well or left to chance.
We'll publish the RSS 100 quarterly, expanding to additional sectors and tracking score movement over time. As more companies complete their own RSS assessments, we'll also begin benchmarking individual firm scores against sector and company-size cohorts — giving every client the ability to understand not just their absolute performance, but their competitive position within it.
RSS 100 is published quarterly. All scores based on publicly observable GTM signals. This analysis does not constitute investment advice.